InfoBrief
Explore the essentials for AI success in our latest InfoBrief, "Building a Cloud Data Foundation for the AI Era," sponsored by Aiven and Google Cloud. Learn to adapt data platforms for AI success.
InfoBrief
Explore the essentials for AI success in our latest InfoBrief, "Building a Cloud Data Foundation for the AI Era," sponsored by Aiven and Google Cloud. Learn to adapt data platforms for AI success.
What does Aiven do?
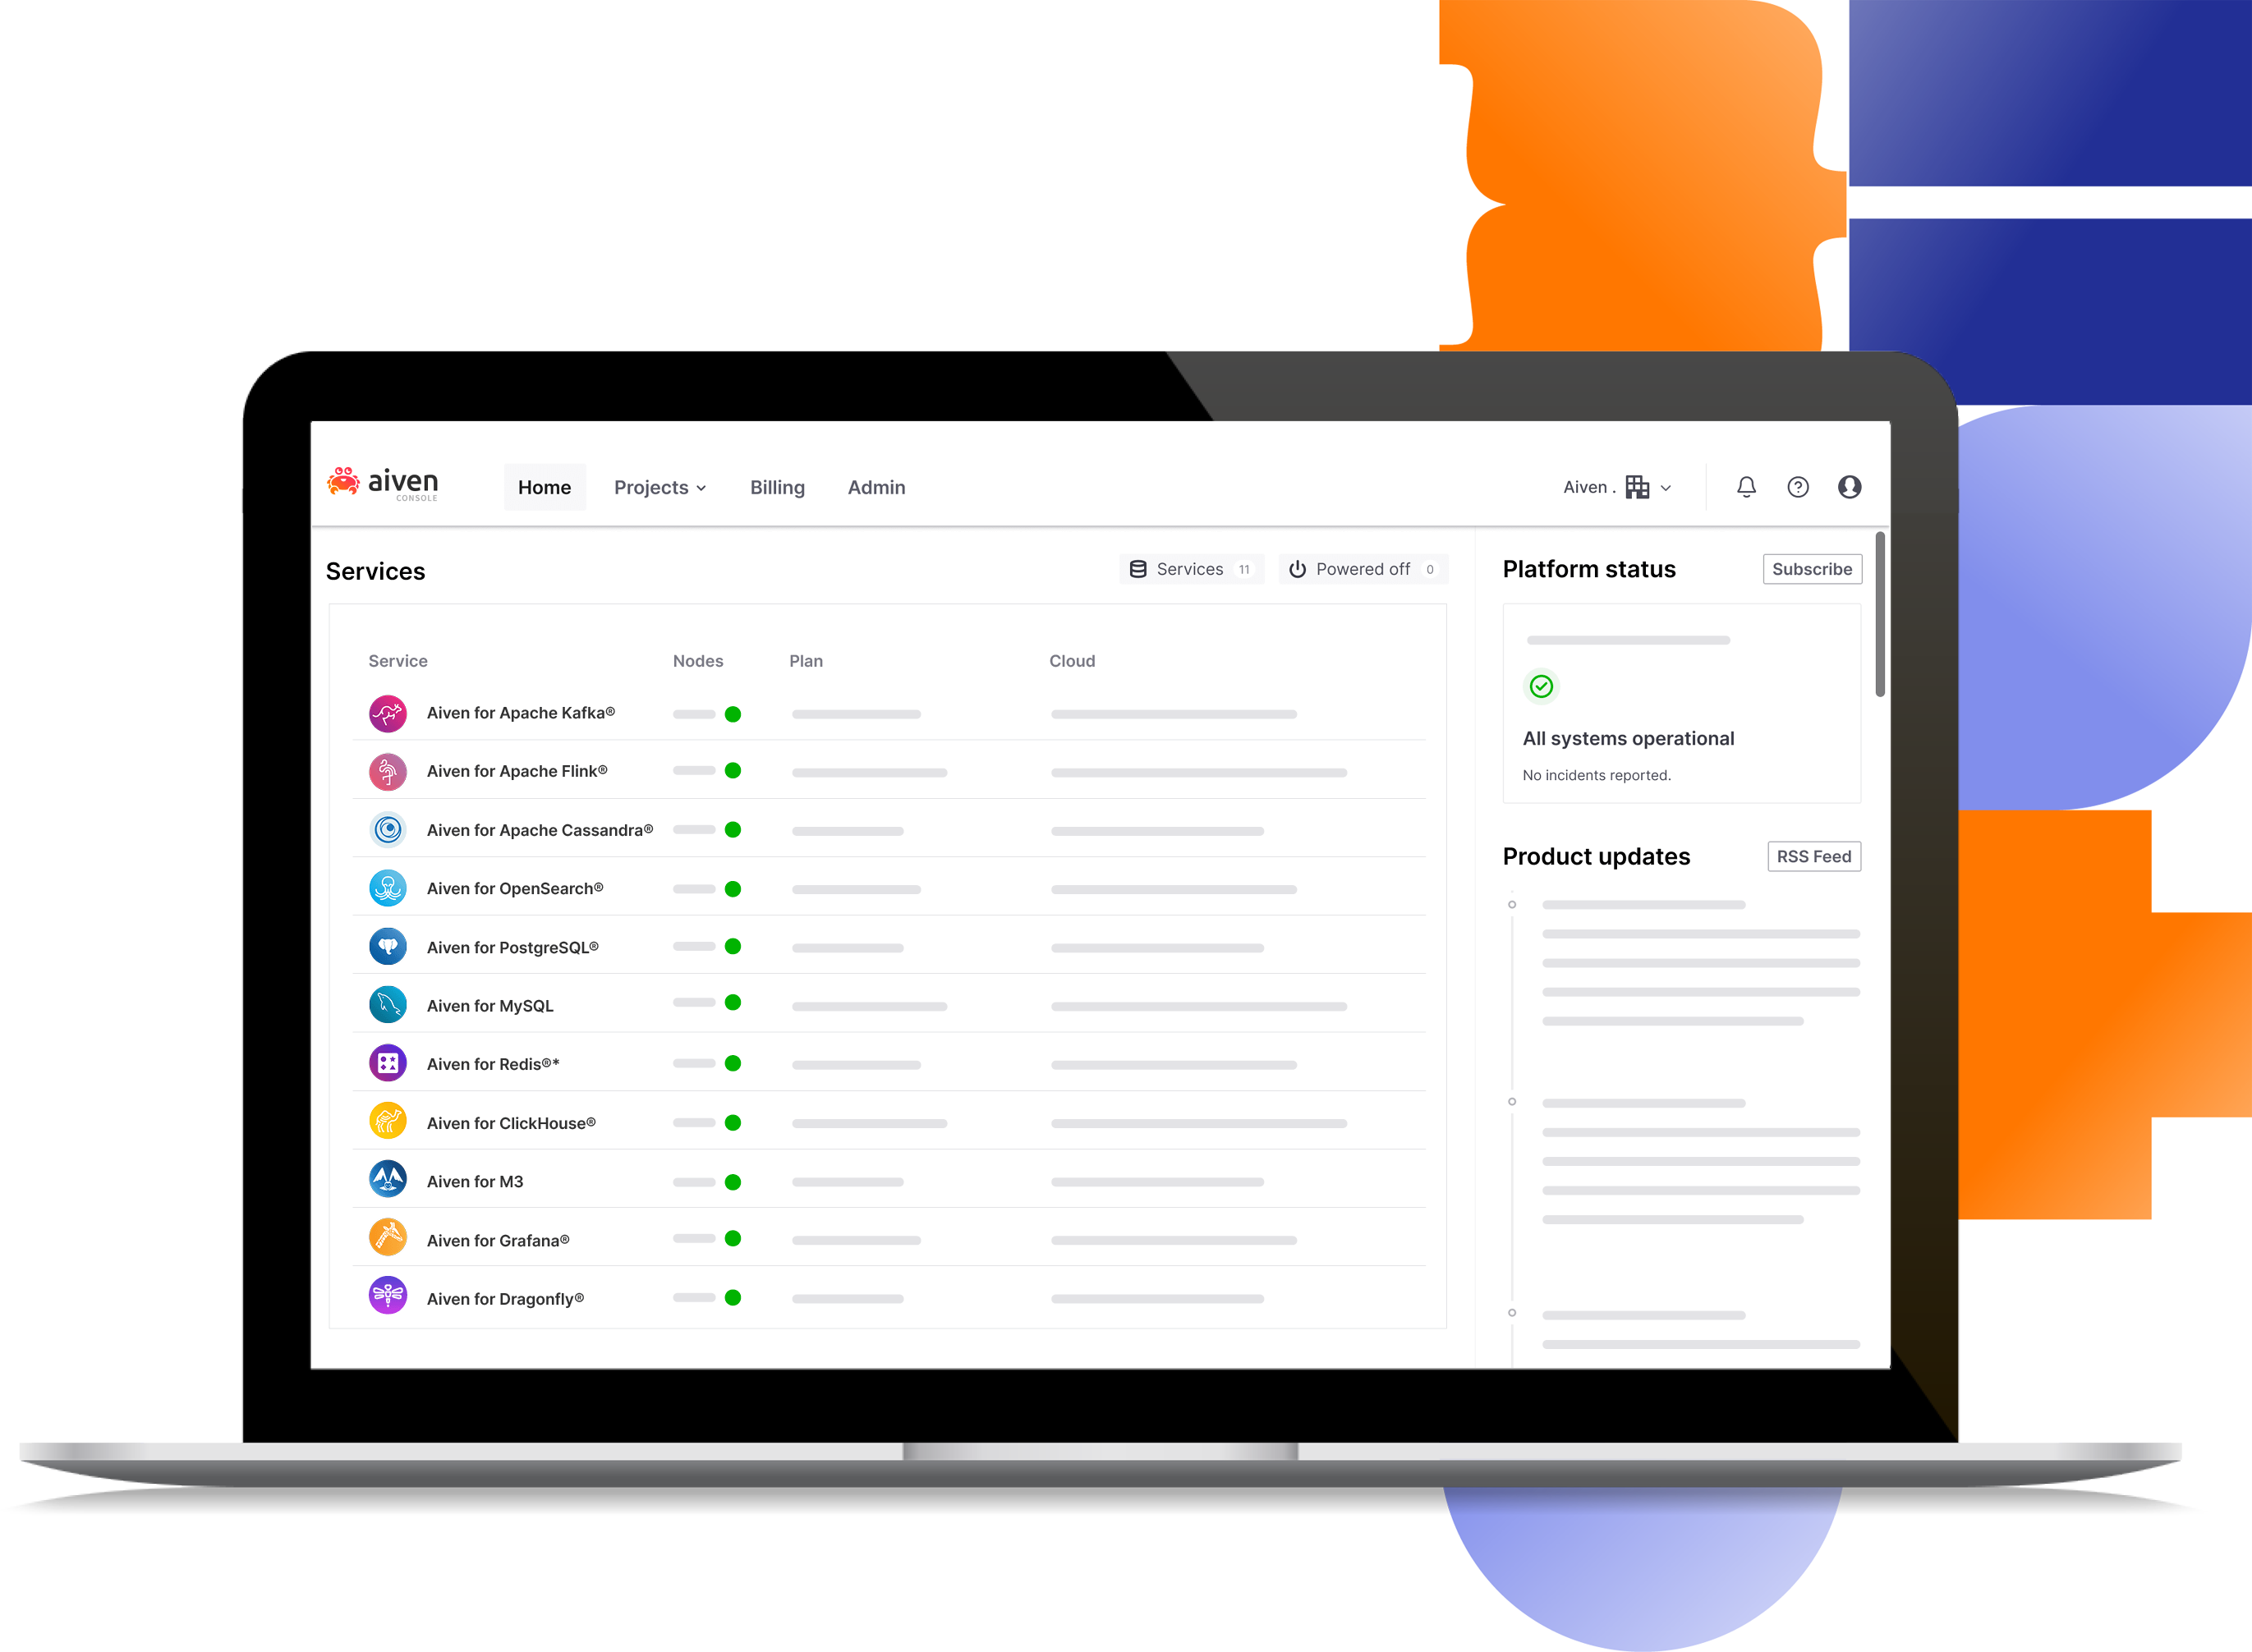
The Aiven platform takes the pain out of cloud data infrastructure management. Aiven’s all-in-one cloud data platform combines all the tools you need to connect to the data services you use, on all major cloud providers.

All the cloud providers and tools you need in one place.

Create fully-featured, fully managed data infrastructure in under 10 minutes.

Stay in control of your data using powerful open-source services.
Services
Deploy


Tooling


Third-party integrations


Security & Network


Identity management


Managed


Compliance


Comprehensive selection of major cloud providers and regions – ready for multi cloud deployments

Easily monitor and manage your cloud data infrastructure with the tools of your choice. Visit our integrations and connectors page

High availability included as part of the open source feature set – perfect for EDA applications

Increase your servers, storage, or migrate to a different provider at the push of a button, with zero downtime

Customers love our expert 24/7 support, available 365 days a year. We’re there for you when you need us

End-to-end encryption, dedicated VMs, and full compliance certifications
Aiven actively engages with the open source data community at conferences, meetups, webinars and events around the world. View our events calendar and come to meet us!
Workshop
Learn how to prepare your existing content for AI using LangChain and store it in OpenSearch®, so it can be used with an LLM in the Retrieval Augmented Generation (RAG) pattern.
This workshop is 1,5 hours long.
May 8, 2024
16:00 - 17:30 UTC
Online
Explore the essentials for AI success in our latest InfoBrief, "Building a Cloud Data Foundation for the AI Era," sponsored by Aiven and Google Cloud.
The Aiven Platform takes the pain out of cloud data infrastructure management.